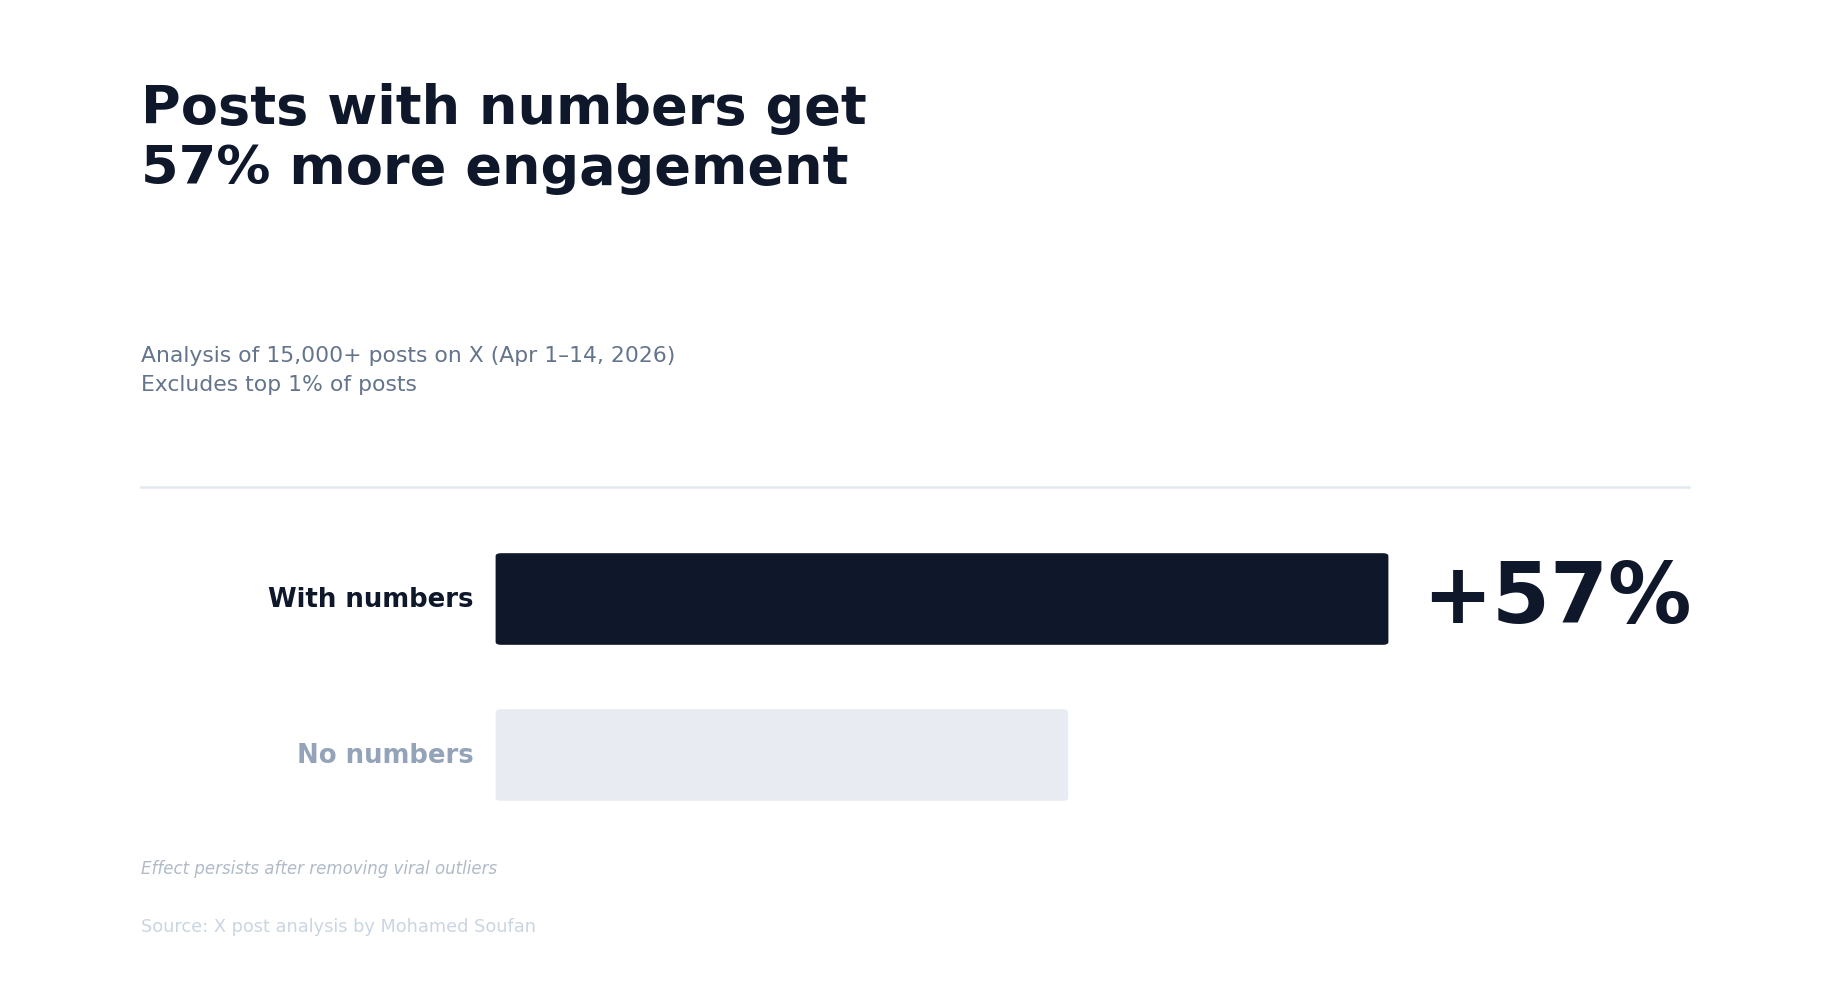
Posts with numbers get 57% more engagement on X
Posts that include numbers—like “5 habits” or “30% growth”—perform significantly better on X. An analysis of 15,000+ posts finds they get 57% more engagement and are 31% more likely to go viral.


Most posts on X get little to no engagement. A few perform well, but it’s often unclear why.
One pattern stands out.
In an analysis of more than 15,000 posts about productivity and habits, posts that included numbers—like “5 habits” or “30% improvement”—consistently outperformed those that didn’t. On average, they received 57% more engagement.
They were also 31% more likely to go viral.
This difference isn’t driven by a few big posts. It holds even after removing the most viral 1% of content.
In short, posts with numbers don’t just look different. They perform differently.
How posts with numbers perform on X
This wasn’t a small or isolated effect. It showed up across the board.
Posts with numbers got more likes, more reposts, and more replies. They weren’t just seen more—they triggered more interaction.
They also got attention more often. About 63% of posts with numbers received at least one interaction, compared to 53% of posts without numbers.
That gap matters. It means posts with numbers are not just performing better at the top, but they’re also more reliable across the entire feed.
Is the effect driven by viral posts?
At first, the difference looks even bigger.
Across all posts, those with numbers show 83% more engagement. But some of that comes from highly viral posts pulling the average up.
When those outliers are removed, the gap drops to 57%—still a large and meaningful difference.
In other words, this isn’t just about a few big hits. The effect holds across normal posts as well.
Why numbers seem to work
Numbers make posts easier to process.
They give structure. They tell the reader what to expect. A post that says “5 habits” is clear before you even finish reading the sentence.
That clarity likely makes people more willing to stop, read, and react.
Numbers can also make content feel more concrete. Even a simple figure can signal that the post is specific and thought through, rather than vague or generic.
What this means for posting on X
Most posts on X disappear quickly. They compete for attention in a crowded feed.
This analysis shows that small changes in how a post is written can have a real impact on how people respond.
Adding a number doesn’t just organize the content, but it makes the post more likely to be seen, shared, and discussed.
For anyone trying to get attention on X, that’s a simple advantage.
Methodology
Posts were collected from X using keyword search across four topic clusters: productivity/productive, habits/daily habits/better habits, focus/deep focus/stay focused, and discipline/self-discipline. Searches were limited to English-language original posts published between April 1–14, 2026. Retweets and reply-type posts were excluded. The initial dataset contained 15,000 posts.
The dataset was then cleaned by removing 57 duplicate posts, 128 posts under five words, and 71 clearly off-topic posts (0.5%), including unrelated sports content and spam. The final sample included 14,743 posts.
Posts were split into two groups. The first group included posts containing at least one meaningful numeric reference (3,340 posts). The second group included posts with no numbers after filtering (11,403 posts). Non-meaningful numbers were removed before classification, including years (2020–2026), time formats (e.g. 3:30, 10am), and digits within usernames, hashtags, or URLs. Remaining numbers—such as “5 habits,” “30%,” or “100 days”—were treated as meaningful. Quote tweets were kept and flagged separately (1,395 posts).
Engagement was defined as the sum of likes, reposts, and replies. For each group, average engagement, median engagement, the share of posts receiving at least one interaction, and representation in the top 10% of posts by engagement were calculated.
To account for viral outliers, results were computed twice: once on the full dataset and once after removing the top 1% of posts by engagement (148 posts, threshold: 1,784 engagements). The trimmed result (+57%) is used as the main reported figure, as it reflects typical performance. The full-sample result (+83%) is included for transparency.
The reported +57% reflects the difference in average engagement between posts with and without numbers in the trimmed dataset. The +31% “viral” effect reflects the higher share of numbered posts in the top 10% of posts (29.8%) compared to their share in the full dataset (22.7%).
This analysis measures association, not causation. Posts with numbers may differ in other ways beyond the presence of numbers itself.
Full data and code available on GitHub.
Note
This analysis shows association, not causation. Posts with numbers may differ in other ways beyond the presence of numbers itself.
Related Research


Media & Contact
For media inquiries or interviews about this research, please use the contact page.


